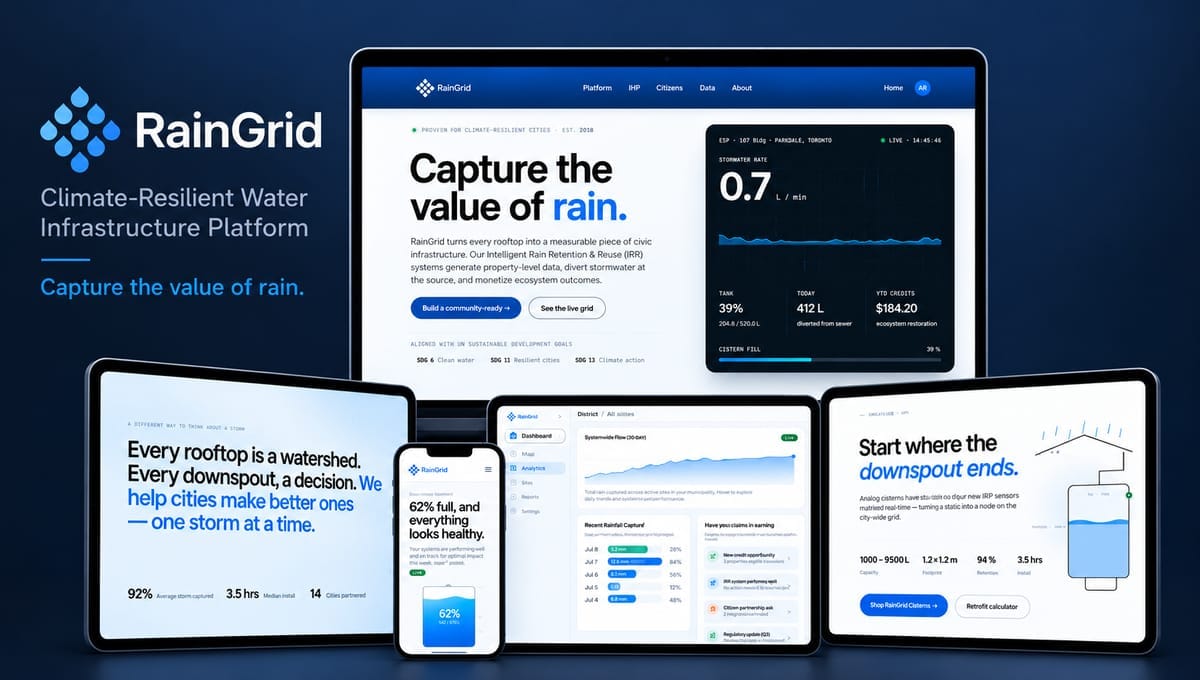
RainGrid's promise is simple: capture the value of rain. Its Intelligent Rain Retention & Reuse (IRR) systems turn every rooftop into a measurable piece of civic infrastructure — generating property-level data, diverting stormwater at the source and turning those environmental outcomes into credits. We built the digital platform that makes that infrastructure visible: a public website, a live view of each connected site, a district dashboard for municipalities and a mobile experience for residents.
Overview
Stormwater is a growing problem for cities: heavy rain overwhelms sewers, while the water itself goes to waste. RainGrid tackles it one building at a time with sensor-connected cisterns that capture rain where it falls. But a cistern on its own is invisible — residents can't see what it's doing, and cities can't see what thousands of them achieve together.
The platform closes that gap. It turns raw readings from individual tanks into information each audience can act on: residents see how full their tank is and how much water they've kept out of the sewer, municipalities see rainfall captured across every active site, and the public site explains why it all matters — framed around the UN Sustainable Development Goals for clean water (SDG 6), resilient cities (SDG 11) and climate action (SDG 13).
Solution
We designed RainGrid as one platform with four connected experiences:
- The public website — leads with "Capture the value of rain", explains the IRR approach in plain language, and gives cities, citizens and partners clear paths in, from "Build a community-ready" to "See the live grid".
- The live site monitor — a real-time card for each connected building showing the current stormwater rate, a live flow chart, tank level, litres diverted from the sewer today, year-to-date ecosystem credits and cistern fill.
- The district dashboard — a municipal view with systemwide flow over 30 days, recent rainfall capture by day, and an activity feed of credit opportunities, system-health notices, citizen partnership requests and regulatory updates, with dedicated map, analytics, sites and reports sections.
- The resident app — a mobile view that answers the one question a homeowner has ("is everything working?") at a glance, with tank level and status front and centre.
Process
Making sensor data readable
The hardest design problem was translation. A sensor reports litres and flow rates; a resident wants to know their tank is healthy, and a city officer wants to know what a storm did across a district. We gave each audience its own level of detail — a single reassuring status line on mobile, live numbers and a fill gauge per site, and trends and comparisons on the district dashboard — all drawing on the same underlying readings.
Designing for live data
Because the readings are live, the interface had to feel live without becoming noisy. Real-time values sit in a high-contrast dark card with a clear "LIVE" indicator and timestamp, while historical views use calm, light layouts with simple area charts and daily bars. Every number carries its unit and context — "diverted from sewer", "ecosystem restoration" — so it reads as an outcome rather than a statistic.
Connecting product and platform
The website also sells the hardware. Product pages for RainGrid cisterns ("Start where the downspout ends") explain how sensors turn a static tank into a node on the city-wide grid, set out capacity, footprint and installation details, and pair a "Shop RainGrid Cisterns" call to action with a retrofit calculator, so homeowners can check fit before they buy.
Responsive across every screen
The platform works across desktop, tablet and mobile: the marketing site and dashboards on larger screens, and the resident experience built mobile-first, so the same data reaches a council office and a homeowner's phone.
The result
The result is a platform that matches the ambition of RainGrid's infrastructure: rainfall captured on a single rooftop becomes visible to the resident who owns it, the city that benefits from it and the public the company wants to win over. If you're building a product around live data — IoT, climate tech or anything sensor-driven — book a free scoping call and we'll map out the dashboards and data flows it needs, then quote the build fixed-price.
More case studies